BFCM Attribution Mistakes US DTC Brands Make — And How to Fix Them (2026)
By Kedar Prasad PV
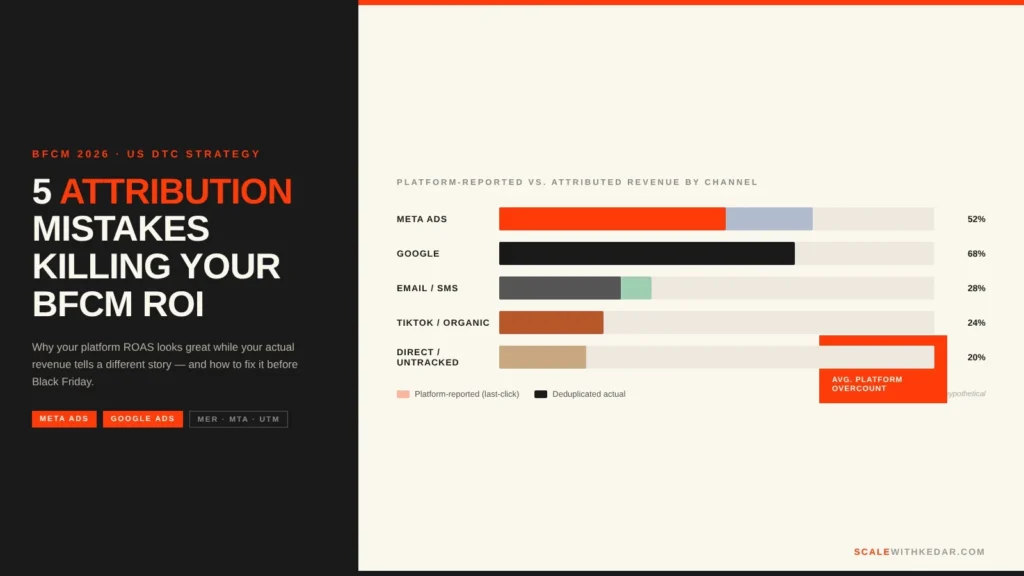
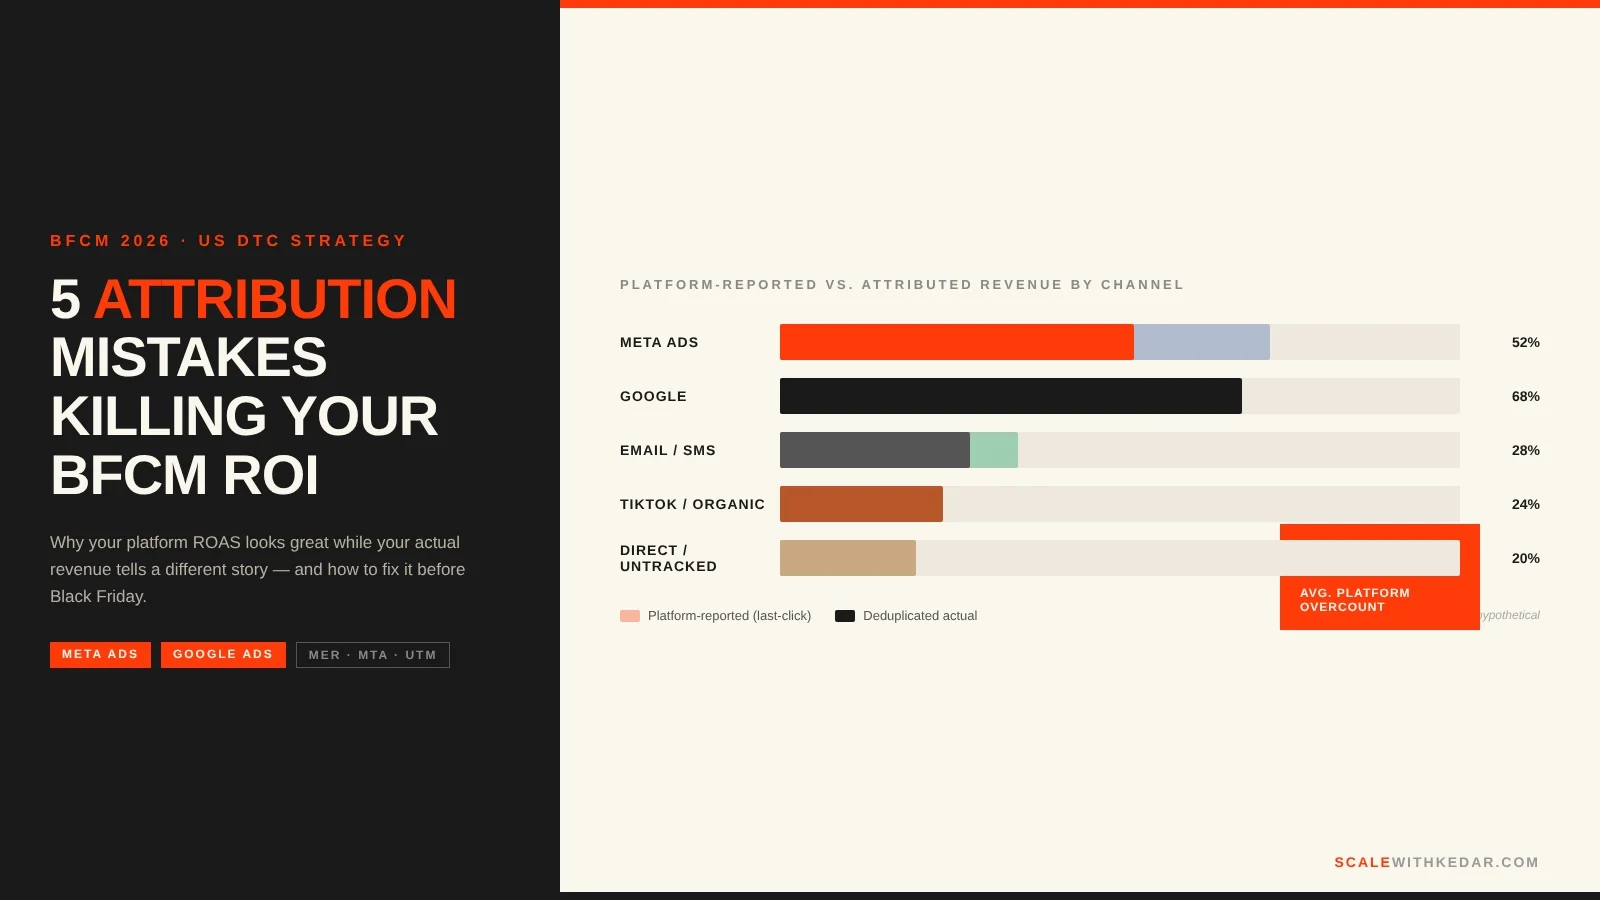
Five attribution mistakes destroy BFCM decisions for US DTC brands every year: trusting platform-reported ROAS as a primary signal, defaulting to last-click during a multi-touch buying cycle, ignoring cross-channel overlap that double-counts conversions, missing off-platform halo effects that pixels never see, and running the wrong attribution window while the sale is live. The result is that ad spend decisions get made on inflated numbers, winning channels get cut, and BFCM ROI looks great in dashboards while actual revenue disappoints. Here is how to identify each mistake and fix it before November.
Why BFCM Attribution Breaks Harder Than Normal Months
During a normal sales week, a US DTC brand might run two or three paid channels and send one to two emails. During BFCM, that same brand is running Meta, Google, TikTok, Pinterest, and affiliate simultaneously while sending daily email and SMS blasts via Klaviyo, retargeting every past visitor, and competing with every other brand for the same audience. That compressed, multi-channel environment creates conditions where every standard attribution model fails at once.
UTM parameters get stripped. Promotional codes overlap. A customer who clicked a Meta ad, received a Klaviyo email, and then searched your brand name on Google gets counted as three separate conversions across three platforms. Every platform claims the sale. Your Shopify revenue does not grow three times — it stays the same. The gap between “what platforms report” and “what Shopify records” is the attribution gap, and it is always widest during BFCM.
Understanding exactly where your numbers are wrong is the difference between scaling what works and doubling down on the platform with the loudest claim.
Mistake 1: Trusting Platform-Reported ROAS as Your Primary Signal
Platform-reported ROAS is not your ROAS. Meta’s Ads Manager reports conversions using its own pixel with its own attribution window. Google Ads does the same. When you run both simultaneously, each platform claims overlapping credit for the same order. A customer who clicked a Meta ad and then a Google Shopping ad before purchasing will likely appear in both platforms’ conversion counts — but only one order hits Shopify.
Estimates from attribution vendors suggest that platform-reported conversions overstate real results by 15 to 20 percent on average during multi-channel periods. During BFCM, when you are running five channels at once, that overstatement compounds. A Meta ROAS of 4.2x and a Google ROAS of 3.8x can coexist with a Marketing Efficiency Ratio — MER, calculated as total Shopify revenue divided by total ad spend — of 2.6x. The platforms are not lying. They are each reporting their own view of the same revenue pool.
The fix: Use MER as your primary BFCM scaling signal. Before your sale starts, calculate your MER baseline from a comparable prior period. During BFCM, watch MER daily: total Shopify revenue ÷ total paid ad spend. A healthy MER for an established DTC brand typically sits in the 3.0x to 5.0x range, though this varies widely by margin and AOV. If MER holds or climbs as you scale, increase spend. If MER drops while platform ROAS stays flat, the platform numbers are misleading you. A tool like Triple Whale or Northbeam gives you a single blended view, but even a simple Shopify revenue export divided by a manual ad spend tally is more reliable than trusting each platform individually. See our BFCM Paid Media Audit Checklist for a full pre-flight on this.
Mistake 2: Using Last-Click Attribution During a Multi-Touch BFCM
Last-click attribution assigns 100 percent of conversion credit to the final touchpoint before purchase. During a normal month, this is imprecise but manageable. During BFCM, it actively misleads you.
Here is why: a customer discovers your brand through a TikTok video in October, clicks a Meta retargeting ad on Black Friday morning, receives a Klaviyo email at noon, and then searches your brand on Google and clicks a branded search ad before purchasing that evening. Last-click gives Google branded search 100 percent of the credit. You conclude Google is crushing it, increase Google branded spend, and cut your TikTok budget — eliminating the discovery channel that started the whole sequence.
A vendor’s aggregated data (published August 2026) compared last-click and first-click attribution across their account base and found that last-click gave Google 12 percent more credit than first-click while stripping 23 percent of Meta’s contribution. Neither number is “the truth,” but the directional difference shows how much your budget decisions depend on which lens you choose.
The fix: Three actions taken together reduce last-click damage significantly. First, enforce strict UTM naming conventions before BFCM — utm_source=meta not fb not facebook, consistent across every ad set — so your own analytics can see the full path. Second, compare your platform data to a first-click view using whatever MTA tool you have access to; the disagreement between first-click and last-click tells you where discovery is undervalued. Third, run a channel holdout test in early November: pause one mid-funnel channel for one week across a matched geographic audience and measure whether overall MER falls. If it does, that channel has real incremental contribution that last-click was hiding.
Mistake 3: Ignoring Cross-Channel Overlap That Double-Counts Conversions
This is the most common BFCM attribution mistake and the hardest to see inside a single platform’s dashboard. When a US DTC brand runs Meta, Google, and Klaviyo simultaneously to the same audience, each platform fires its pixel or tracking code when it touches the customer. If that customer converts, all three platforms record a conversion. Your Shopify order count does not triple. The gap is double-counting.
A hypothetical example: your brand runs a BFCM campaign and platforms collectively report 3,200 conversions at a combined blended ROAS of 4.1x. Shopify records 1,900 orders. The 1,300-order gap is largely cross-channel overlap. Without reconciling this, you will reallocate spend based on which platform had the highest ROAS — a number that partly reflects which platform happened to be the last touchpoint, not which one actually drove the most incremental revenue.
Running BFCM in the next few weeks? We audit your full attribution stack — UTM hygiene, window settings, MER baseline, and cross-channel overlap — before the sale starts so your budget decisions are made on real numbers.
The fix: Use a single-source attribution tool — Northbeam, Triple Whale, or TriplePixel — as your decision layer and treat platform dashboards as diagnostic tools only. These tools deduplicate conversions using a first-party data layer that reconciles against your Shopify order data. If you are not yet running a dedicated MTA tool, a manual reconciliation is still better than nothing: export Shopify orders daily, match order IDs against your email send and click data from Klaviyo, and compare the total to what Meta and Google report. Any overlap becomes visible immediately.
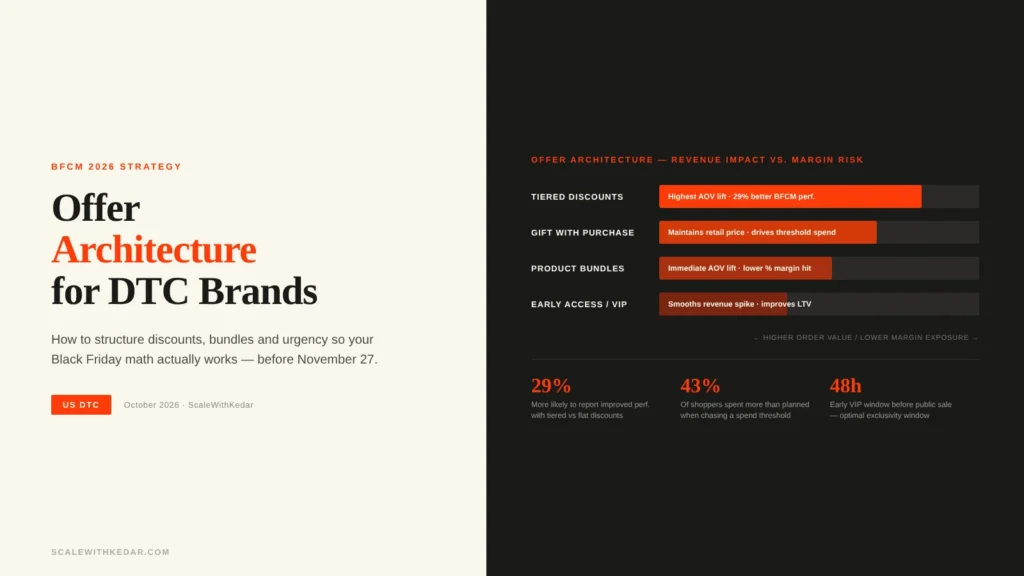
For more on constructing your BFCM offer architecture to reduce cross-channel confusion — such as using channel-specific promo codes — see BFCM Offer Architecture for DTC Brands.
Mistake 4: Missing Off-Platform Halo Effects
Pixels measure clicks. They do not measure conversations, podcast listens, influencer recommendations, or the TikTok video a customer watched three times but never clicked. Off-platform influence — the halo effect — is real and it is systematically invisible to every click-based attribution model.
A commonly cited example from attribution research: a brand ran a Pinterest awareness campaign and measured an 87 percent halo — meaning most Pinterest-driven revenue occurred on other channels after a customer saw the Pinterest content, not through Pinterest clicks. Last-click gave Pinterest zero credit. An MTA model gave it some credit. A geo holdout test revealed the true magnitude. Without the holdout, the brand would have cut Pinterest as a “low-ROAS” channel and eliminated a discovery driver that was feeding Google and Meta conversions downstream.
During BFCM, you are running TikTok, YouTube, influencer content, and email nurture sequences at the same time as your direct-response ads. All of that non-click activity primes the audience to convert when a direct-response ad hits. If you cut non-click channels based on their platform ROAS, you are cutting the kindling that makes the fire possible.
The fix: Add a post-purchase survey to your Shopify thank-you page and your Klaviyo order confirmation email. Ask one question: “How did you first hear about us?” Include response options that match your top-of-funnel channels: TikTok, Instagram, Google Search, Friend Recommendation, Podcast, YouTube, and an open-text “other” field. Run this all year so you have a baseline, and pay close attention to which discovery channels spike during BFCM. The answers will consistently surface channels that your pixel data under-credits.
Mistake 5: Running the Wrong Attribution Window During BFCM
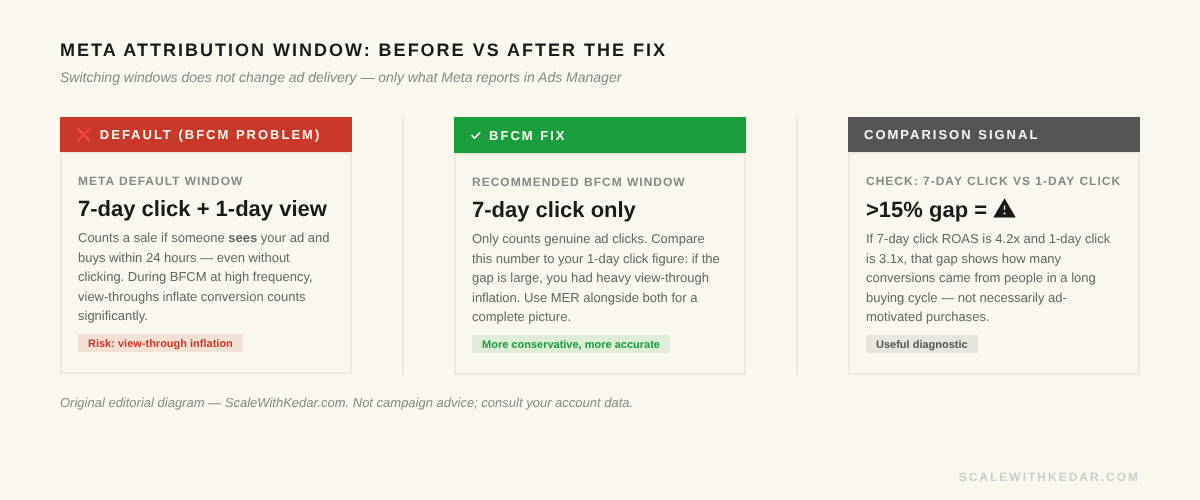
Meta’s default attribution window is 7-day click and 1-day view. The 1-day view setting means that if someone sees your ad — without clicking — and then buys within 24 hours, Meta claims the conversion. During BFCM, when you are running broad retargeting audiences at high frequency, a significant portion of your reported Meta conversions may be view-through attributions from customers who were going to buy regardless of the ad impression.
A directional check: compare your Meta reported ROAS under the default 7-day click + 1-day view window against the 7-day click-only window. If the numbers are materially different — more than 15 to 20 percent apart — a portion of what Meta is calling a Meta conversion is likely an organic, email, or branded search conversion that happened to coincide with an ad impression. Scaling budget based on the inflated window number means paying for impressions that are not driving incremental lift.
The fix: Switch Meta to 7-day click-only attribution for BFCM campaign measurement. This does not change your ad delivery or your bidding; it only changes what Meta reports in Ads Manager. Compare your 7-day click number to your 1-day click number: a large gap suggests heavy view-through attribution. Also check the 1-day click figure — a significant drop from 7-day click may indicate that your ads are primarily converting people who were already in a long purchase consideration cycle, not people the ad newly motivated. Both signals help you understand what Meta is actually driving versus claiming. For how this connects to your email timing strategy, see Klaviyo BFCM Strategy: Email and SMS Flows for US DTC.
Attribution Model Comparison: Which Works Best for BFCM?
| Model | Credit Logic | BFCM Strength | BFCM Weakness |
|---|---|---|---|
| Last-click | 100% to final touchpoint | Simple to implement; highlights closers | Inflates Google branded search and retargeting; eliminates discovery credit |
| First-click | 100% to first touchpoint | Highlights discovery channels (TikTok, awareness Meta) | Ignores all nurture and conversion-intent touches |
| Linear | Equal credit across all touches | No channel gets zero credit; safe baseline | Treats a 3-second view impression the same as a cart-page click |
| Time-decay | More credit to recent touches | Reflects purchase urgency; suits short consideration cycles | Penalises awareness channels that started the journey weeks earlier |
| Position-based (U-shaped) | 40% first, 40% last, 20% middle | Rewards both discovery and conversion; good for longer funnels | Arbitrary weighting; middle touches still under-valued during BFCM |
| MTA (data-driven) | Statistical model across all touches | Most accurate incremental view; reconciles against order data | Requires clean data, volume, and a third-party tool; still misses off-platform |
Recommended BFCM approach: Use MTA (via Triple Whale, Northbeam, or similar) as your primary budget signal. Use MER as your scaling guardrail. Use platform dashboards with 7-day click-only for channel-level diagnostics. Run a post-purchase survey for off-platform signal.
Pre-BFCM Attribution Setup Checklist
Complete this checklist at least three weeks before your BFCM sale starts:
- Audit UTM naming conventions. Standardise every campaign, ad set, and ad across Meta, Google, TikTok, and affiliates. One naming convention, no variations (e.g.,
utm_source=metaeverywhere, neverfborfacebook). - Set your MER baseline. Pull total Shopify revenue and total paid ad spend for a comparable four-week period. Calculate baseline MER. Agree on the floor MER below which you will reduce spend regardless of platform ROAS.
- Switch Meta to 7-day click-only. Update your attribution window in Meta Ads Manager. Document your current default ROAS numbers before you switch so you can compare.
- Verify your MTA tool is reconciling correctly. If using Triple Whale, Northbeam, or TriplePixel, confirm the last 30 days of reported conversions match your Shopify order count within a reasonable margin (under 5 percent). If they do not, fix the pixel or data connection before BFCM.
- Activate post-purchase survey. Deploy a one-question “How did you first hear about us?” survey on your Shopify thank-you page and order confirmation email. Test it with a real order before the sale.
- Set channel-specific promo codes. Assign unique discount codes to each channel where possible (e.g., a TikTok-specific code, an email-specific code). These serve as clean last-touch signals that are independent of pixel attribution.
- Confirm Klaviyo UTM tracking is active. Verify that every BFCM flow and campaign in Klaviyo appends UTM parameters to all links, and that those parameters are passed through correctly to GA4 and your MTA tool.
- Document your holdout test plan. Identify one channel you will pause for 48 hours during early BFCM to measure its incremental contribution against a matched control. This requires geographic or audience-based holdout setup in advance.
- Set up a daily reconciliation spreadsheet. Create a simple sheet: Shopify revenue | Shopify orders | Meta reported conversions | Google reported conversions | Email reported conversions | MER. Fill it in every morning during BFCM week.
- Agree on decision-making authority. Decide in advance: who can increase Meta budget by more than 20 percent? What MER threshold triggers a budget pause? Write it down. Decisions made under BFCM pressure without pre-agreed rules tend to be driven by whichever platform dashboard looks best.
Frequently Asked Questions
Why does my Meta ROAS look great but my overall business performance is flat?
This is the cross-channel overlap problem. Meta is claiming conversions that were also claimed by Google, email, or another channel. Your actual revenue is the same regardless of how many platforms claim it. The fix is to benchmark Meta’s claimed conversions against Shopify order volume, and to use MER as the primary performance signal rather than any single platform’s reported ROAS.
What is a realistic MER target for BFCM?
This varies significantly by brand margin, average order value, and how much awareness spend you are running. A brand with 60 percent gross margins and a high AOV can run a lower MER profitably compared to a brand with 40 percent margins. Rather than anchoring on an industry benchmark, calculate your own contribution-positive MER — the MER at which you are covering ad spend plus your contribution margin target — and use that as your floor. Track how your MER moves as you scale BFCM spend. Most established DTC brands aim for MER between 3.0x and 5.0x, but the right number for your brand is determined by your own unit economics.
Should I pause non-click channels like TikTok if their ROAS is low during BFCM?
Not before you understand whether they have halo value. Run a post-purchase survey and check what percentage of new customers cite TikTok as their first discovery point. If that number is material and your overall MER is healthy, the low ROAS is a measurement artifact, not a performance signal. The risk of pausing a genuine discovery channel during BFCM is that you reduce the top-of-funnel priming that makes your retargeting and email conversions possible — and you will not see the damage until you try to acquire new customers in Q1.
How much does switching Meta to 7-day click-only attribution actually change my reported numbers?
It depends on how aggressively you are running broad audiences. For brands with tight, intent-based audiences and limited impression frequency, the change is modest — often under 10 percent. For brands running broad awareness retargeting at high frequency during BFCM, the gap between 7-day click + 1-day view and 7-day click-only can be 20 to 40 percent. The only way to know your specific number is to make the switch and compare. Do it three weeks before BFCM so you have a new baseline before the sale begins.
Ready to go into BFCM with attribution you can trust? We work with US DTC brands on their full attribution stack — from UTM architecture and MTA tooling to BFCM budget decision frameworks. A clean measurement setup before the sale prevents costly misallocations during it.