Most US DTC brands spend serious money on ads and still can’t figure out why revenue is stagnant. The answer is usually sitting quietly in the customer journey — three or four predictable spots where buyers slip away before converting, or convert once and never come back.
A customer journey map forces you to look at the full experience from the buyer’s perspective, not the funnel metrics your dashboard shows you. Done right, it reveals where revenue leaks are happening and gives you a prioritised fix list that actually moves the needle.
Here’s a practical framework for mapping your DTC customer journey and turning what you find into revenue.

What a DTC Customer Journey Map Actually Is
A customer journey map is a visual or structured document that tracks every interaction a buyer has with your brand — from the first time they see an ad to the fifth time they reorder. It’s not a funnel. A funnel shows you where people drop. A journey map shows you why.
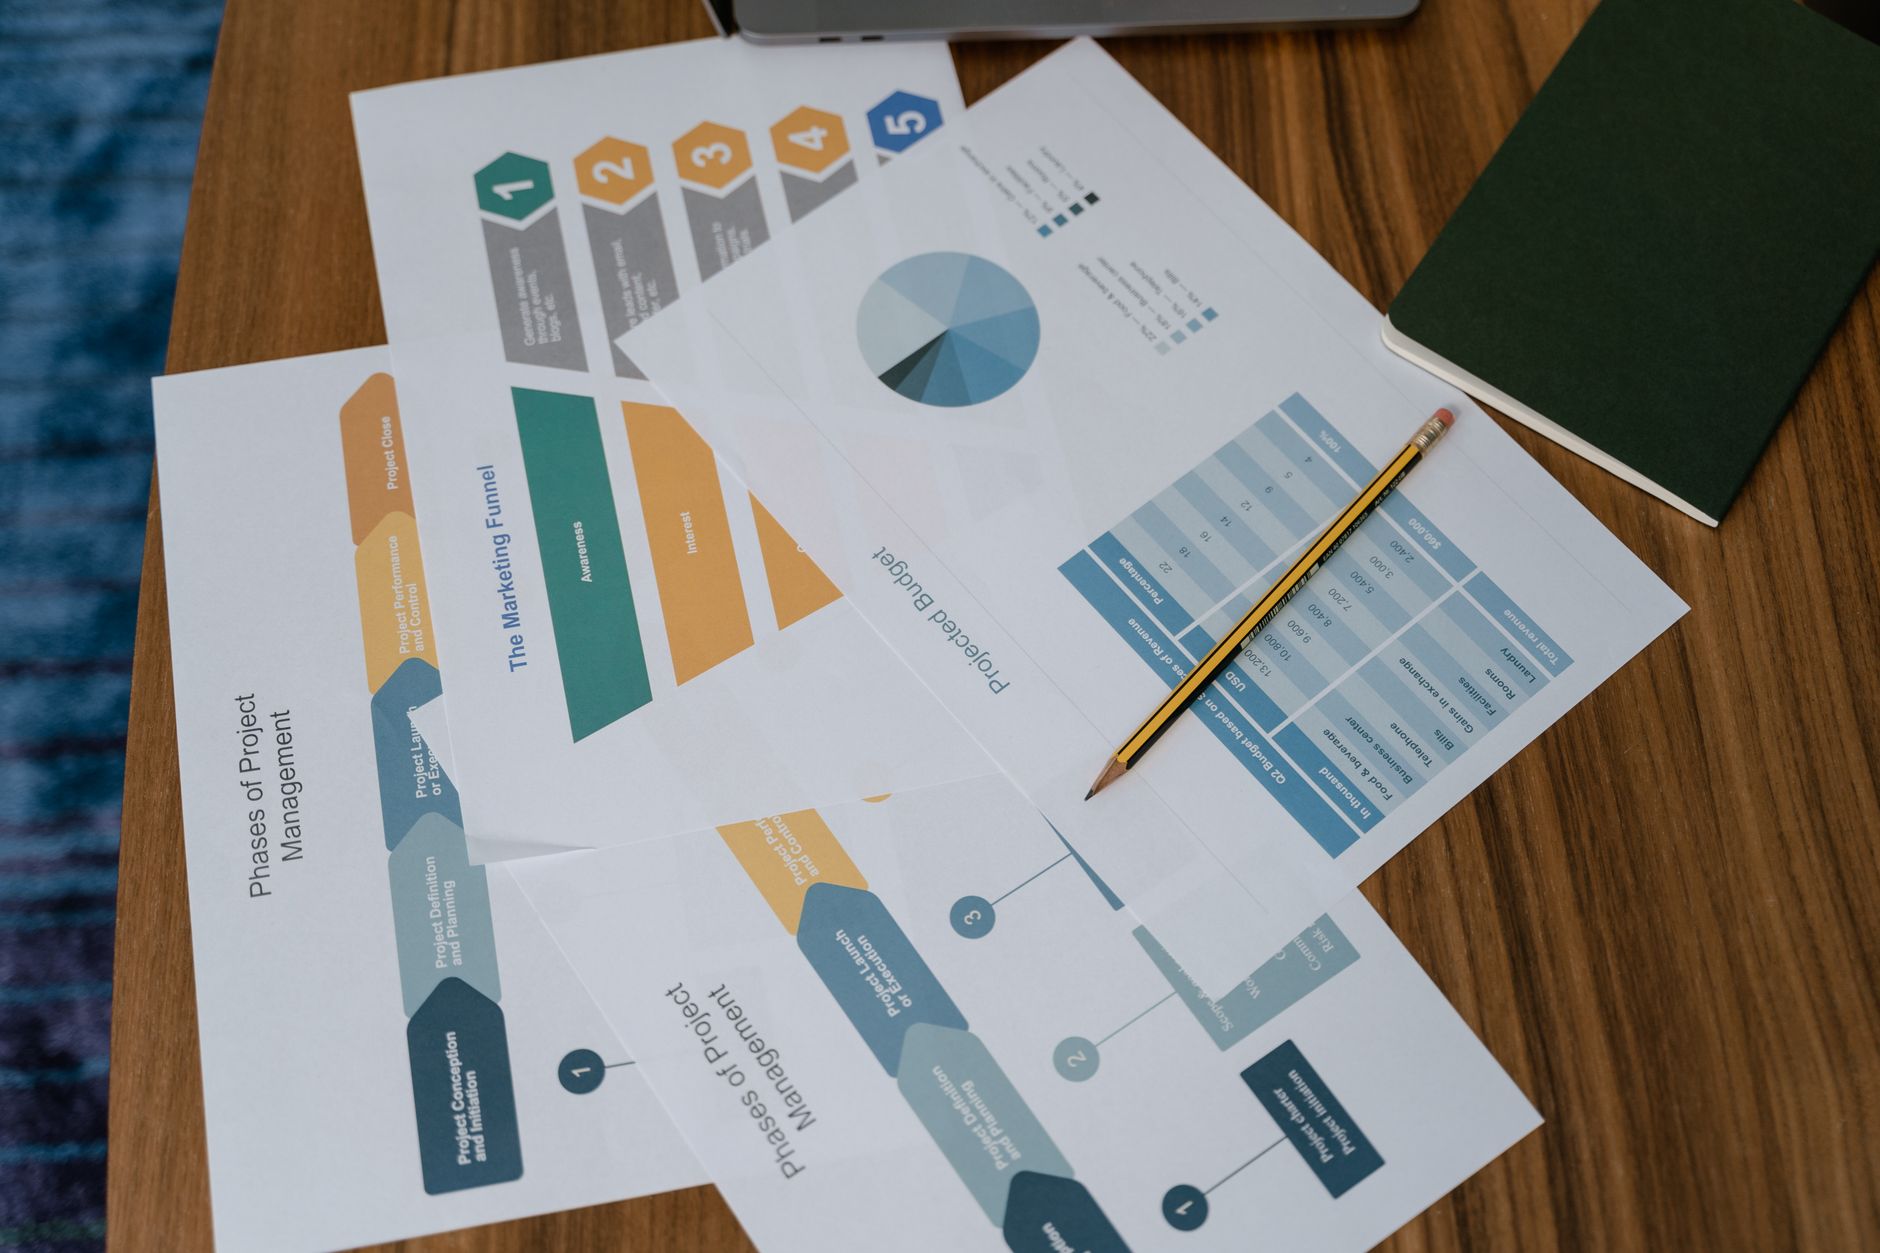
For a DTC brand, the journey usually spans five stages:
- Awareness — How someone first encounters your brand (paid social, organic search, word of mouth, influencer content)
- Consideration — How they evaluate your product (product page, reviews, social proof, comparisons)
- Purchase — The moment they decide to buy (checkout experience, payment options, offer clarity)
- Post-purchase — What happens after the order (confirmation email, unboxing, onboarding)
- Retention — How you earn the second, third, and ongoing orders (loyalty, email, SMS, referral)
Most DTC brands only measure Awareness and Purchase closely. Consideration, Post-purchase, and Retention are where the real money gets left on the table.
How to Build Your DTC Customer Journey Map
Step 1: Define Your Core Customer Segment
Don’t map a journey for a hypothetical “target audience.” Pick your actual top buyer — your highest-LTV customer segment from the last 90 days. Pull from Shopify customer data, Klaviyo segments, or your analytics. Who orders most often? Who has the highest average order value? That’s who you’re mapping for.
If you sell a product that appeals to multiple distinct buyer types (say, both individual consumers and small businesses), map each separately. One journey map per distinct segment.
Step 2: List Every Touchpoint
Go through every place where a buyer interacts with your brand. For most US DTC brands, that’s a list that includes:
- Meta or TikTok ad (first touch)
- Landing page or product page
- Social proof layer (reviews, UGC, influencer content)
- Cart and checkout flow
- Order confirmation email and SMS
- Shipping notification
- Product unboxing and insert
- Post-purchase email sequence (days 3, 7, 14)
- First repeat purchase prompt
- Referral or loyalty program touchpoint
For each touchpoint, note: what’s the buyer’s goal at this moment? What do they need to feel or understand to move forward? What friction exists?
Step 3: Map the Emotional State at Each Stage
This is where journey mapping goes beyond funnel analysis. At each touchpoint, ask: what is the buyer feeling? Curious? Skeptical? Frustrated? Excited? Disappointed?
You can get this data from customer support tickets, reviews (particularly one-star and three-star reviews — the middle ground is more honest than extremes), post-purchase surveys, and session recordings on your product page and checkout.

The 3 Most Common DTC Revenue Leaks
After mapping hundreds of DTC journeys, the same three leak points appear repeatedly for US brands.
Leak #1: The Product Page Drop-Off
The buyer lands on the product page interested but leaves without adding to cart. Usually the problem is one of three things: the value proposition isn’t clear above the fold, social proof is weak or poorly positioned (pushed below the fold, too few reviews, no photos), or the offer structure creates confusion (too many variants, ambiguous pricing, unclear shipping).
Fix: Run a heatmap and session recording audit on your top product page for 2 weeks. Look for rage clicks, scroll depth drop-offs, and where mobile users abandon. Then A/B test one change at a time — lead with your strongest benefit statement, move your highest-rated review above the fold, and simplify variant selection.
Leak #2: Cart Abandonment That Isn’t Being Recovered
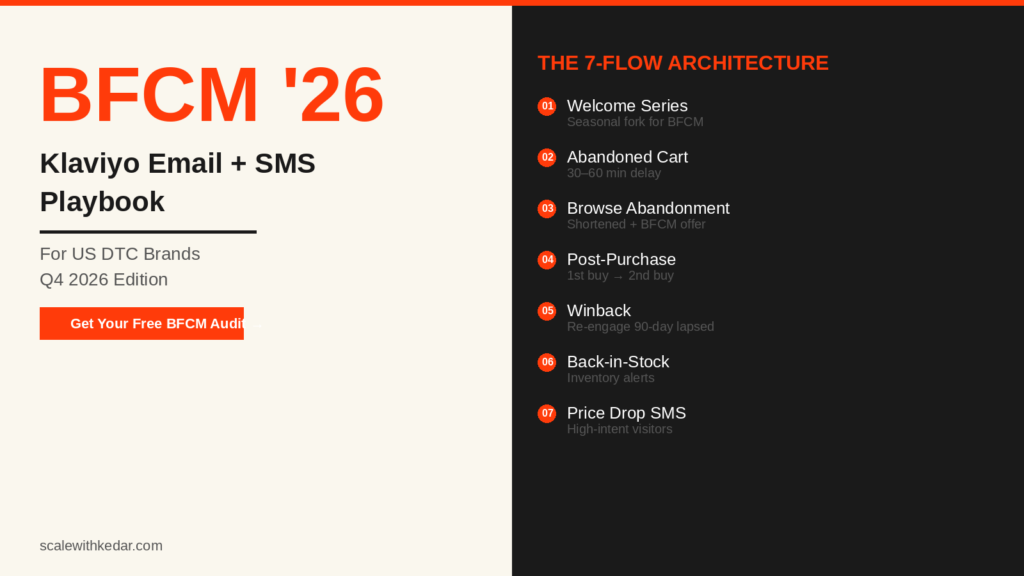
Most DTC brands have a cart abandonment email. Most of those emails go out 1 hour after abandonment, offer a discount, and stop after one message. That’s not a recovery sequence — it’s a polite suggestion.
The average US DTC buyer who abandons a cart needs to see the product 2–3 more times across multiple channels before they convert. An email at hour 1, a retargeting ad on Meta for 5 days, and a second email at 24 hours with social proof (not just a discount) will recover significantly more revenue than a single coupon email.
Fix: Build a 3-touch recovery sequence: email at 1 hour (urgency + clarity on what they left), Meta retargeting for 5 days (showing the specific product), and email at 24 hours (leading with a customer review, not a discount). Measure incremental recovered revenue against what your current single-email sequence produces.
Leak #3: No Second-Purchase Strategy
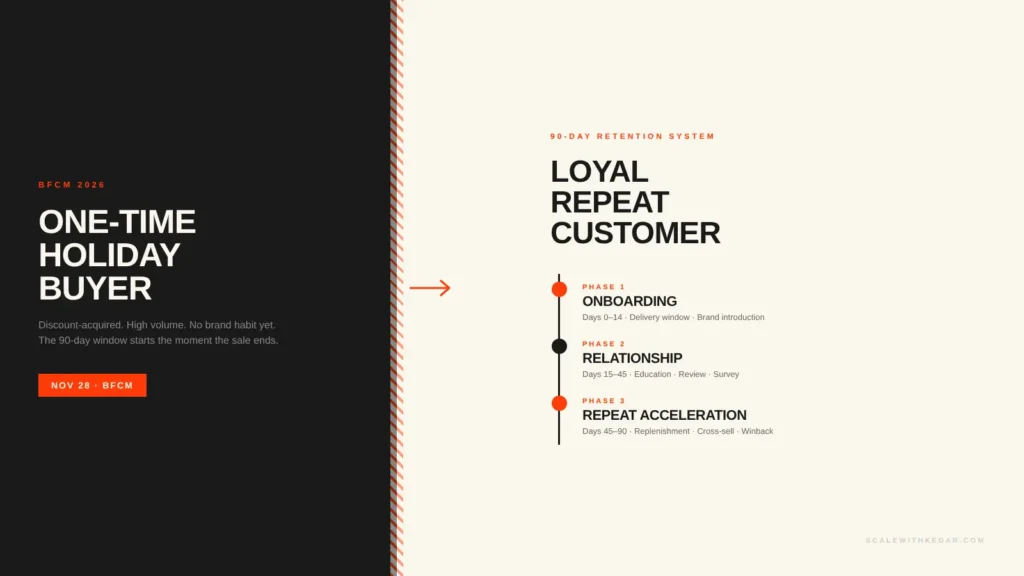
Acquiring a new US customer costs between $30 and $150 depending on your category. The entire economics of a healthy DTC brand depend on that customer buying again. Yet most DTC brands’ post-purchase sequence is: order confirmation, shipping update, delivered notification. Then silence.
There’s no attempt to educate the buyer on getting the most from the product, no prompt to share the experience, no bridge to the second purchase before the excitement of receiving it fades.
Fix: Build a 14-day post-purchase flow. Day 3: usage or care tips (practical value). Day 7: ask for a review (when satisfaction is highest). Day 10: introduce a complementary product (cross-sell with genuine relevance). Day 14: first repeat purchase prompt with a loyalty hook (early access, points, referral). This sequence alone can lift repeat purchase rate by a meaningful margin for most mid-stage DTC brands.
How to Prioritise What You Fix First
Once you’ve mapped your journey and identified the leaks, you’ll likely have a list of 8–12 things to fix. The prioritisation framework is simple: highest revenue impact, lowest effort to implement.
Rate each fix on two axes:
- Revenue impact: How much revenue does this touchpoint touch? A checkout page fix affects 100% of your buyers. A loyalty email affects returning buyers only.
- Implementation time: Can this be live in a week, or does it need a 3-month development sprint?
Start with the top-right quadrant: high impact, fast to implement. For most DTC brands, that means the product page social proof fix and the post-purchase email sequence. Both can be live in under two weeks and directly touch revenue you’re already close to capturing.
Tools to Make Customer Journey Mapping Concrete
You don’t need expensive software. A Google Sheet or Notion table with columns for Stage, Touchpoint, Buyer Goal, Emotional State, Current Performance, and Fix Priority gives you everything you need to start.
For data to fill the map, use:
- Microsoft Clarity (free) for heatmaps and session recordings on your product and checkout pages
- Klaviyo or your ESP for email open, click, and conversion rates by sequence step
- Shopify Analytics for purchase-to-repeat-purchase rate and average days to second order
- Triple Pixel or Northbeam for cross-channel attribution if you’re spending at scale on paid social
The goal isn’t a perfect map. It’s a working document that makes revenue leaks visible and gives your team a shared frame for fixing them.
What a Fixed Journey Looks Like
When you close the main leak points in a typical US DTC journey, the result isn’t a single dramatic improvement in one metric — it’s a compound effect across the whole model. Conversion rate goes up modestly. Cart recovery captures more of what was already close. Repeat purchase rate climbs. Customer lifetime value grows. Together, those small lifts turn into materially better unit economics and a business that doesn’t have to keep buying new customers at escalating CAC to stay alive.
That’s the real value of mapping the journey: not the insight itself, but what you do with it.
Need Help Auditing Your DTC Customer Journey?
If you want a structured audit of your DTC brand’s customer journey — from paid acquisition through retention — and a prioritised fix list, get in touch. I work with US DTC and ecommerce brands to diagnose funnel gaps and build the sequences that recover and retain revenue.
Related reading: